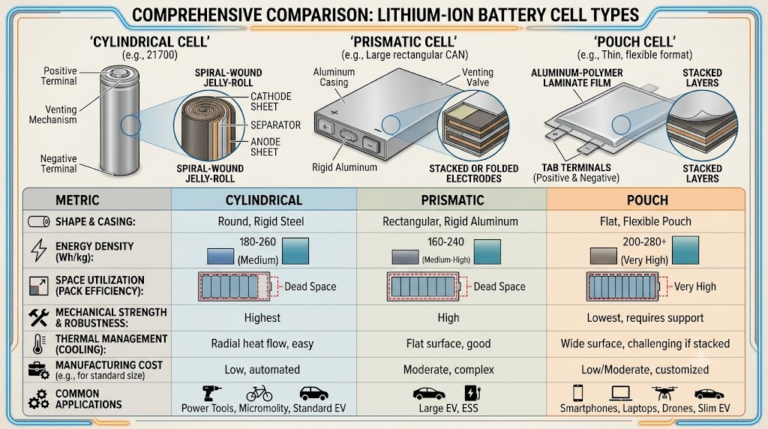
Solid-State Battery Sample Testing: OEM Validation Guide
Incoming All-Solid-State Battery Sample Testing: The Commercial Reality Check
Procuring all-solid-state battery (ASSB) samples requires bypassing supplier datasheets generated under hyper-idealized laboratory conditions. Engineering teams regularly evaluate incoming cells that advertise energy densities exceeding 400 Wh/kg, only to find the cells cannot operate outside rigid hydraulic presses or elevated isothermal test chambers.
To establish commercial viability, hardware procurement teams must mandate incoming cell validation under realistic physical boundaries. Real-world battery enclosures cannot accommodate 5 MPa to 50 MPa clamping fixtures without wiping out pack-level gravimetric energy density.
Evaluating incoming solid-state cells demands strict adherence to rigorous test standards like IEC 62660-2 alongside customized mechanical protocols. Verification must cover high-frequency bulk impedance, dynamic lithium metal anode expansion, interfacial void formation, and cell stability under realistic stack pressures (≤1.0 MPa).
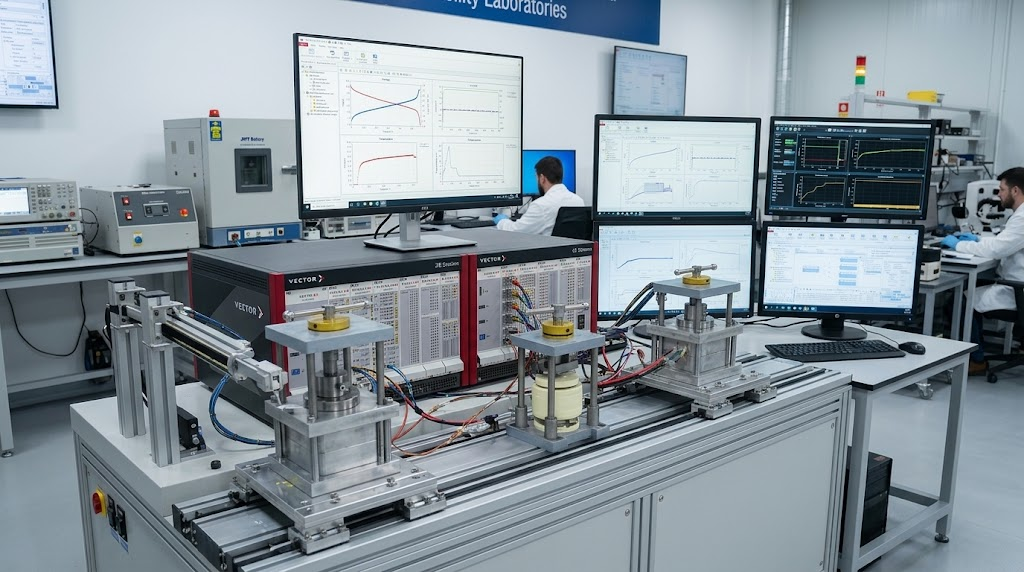
The 5-Stage ASSB Commercial Viability Matrix: Engineering Evaluation Framework
The 5-Stage ASSB Commercial Viability Matrix bridges the gap between fundamental solid-state electrochemistry and pack-level mechanical integration. Evaluating all-solid-state battery sample testing requirements requires benchmarking incoming samples against five critical dimensions: mechanical stack pressure thresholds, chemo-mechanical interfacial stability, decoupled thermal operating envelopes, operando anode expansion rates, and ppm-level manufacturing tolerances.
Relying on unconstrained pouch-cell benchmarks inevitably causes field failure. Without uniform contact pressure, solid-state electrolyte interfaces delaminate during cyclic volume changes, leading to accelerated capacity fade or short-circuits from lithium dendrite penetration.
| Evaluation Dimension | Academic / R&D Testing Boundary | Commercial Target (JHY Battery Standard) | Integration Failure Mode If Unchecked |
|---|---|---|---|
| 1. Uniaxial Stack Pressure | 5.0 MPa to 50.0 MPa (Hydraulic/Piston) | ≤ 0.5 MPa to 1.5 MPa (Passive mechanical springs) | Excess fixture weight destroys pack energy density; tab weld failure. |
| 2. Operating Temperature Split | Isothermal +60°C constant heating | Charge: 0°C to +45°C | Discharge: -40°C to +80°C | Interfacial impedance surge; lethal dendrite shorting during cold charging. |
| 3. Interfacial Stability (CCD) | 0.1 mA/cm² to 0.5 mA/cm² at low areal capacity | ≥ 5.0 mA/cm² at ≥ 3.5 mAh/cm² areal capacity | Lithium plating filaments penetrate ceramic/sulfide separator at practical C-rates. |
| 4. Operando Dynamic Expansion | Ignored (Rigid unyielding steel frame) | Dynamic breathing monitored (Δd ≤ 12% at 100% DOD) | Pouch envelope rupture; localized high-pressure points cause separator fracture. |
| 5. Incoming Quality Control | Single pouch baseline testing (n=1 to 3) | ΔV ≤ 3mV, ΔACIR ≤ 0.3mΩ, 300 PPM Defect Limit | Premature module failure driven by thermal mismatch and cell divergence. |
The 5-Stage ASSB Commercial Viability Matrix: A comprehensive hardware evaluation framework that mandates evaluating all-solid-state cells under commercial packaging boundary conditions (uniaxial compression ≤1.5 MPa, distinct charge-versus-discharge thermal windows, and continuous operando displacement monitoring) rather than unconstrained laboratory parameters.
Deploying this matrix early in the engineering review process prevents teams from committing capital to solid-state pouch formats that cannot scale into functional custom battery packs.
Electrochemical Impedance Spectroscopy (EIS) Deconvolution: Bulk vs Interfacial Resistance
Electrochemical Impedance Spectroscopy (EIS) serves as the primary non-destructive diagnostic method for screening incoming solid-state cells. Technicians must conduct frequency sweeps from 100 kHz down to 10 mHz under precise AC voltage amplitudes (5 mV to 10 mV RMS) to prevent disturbing the dynamic solid electrolyte interphase (SEI).
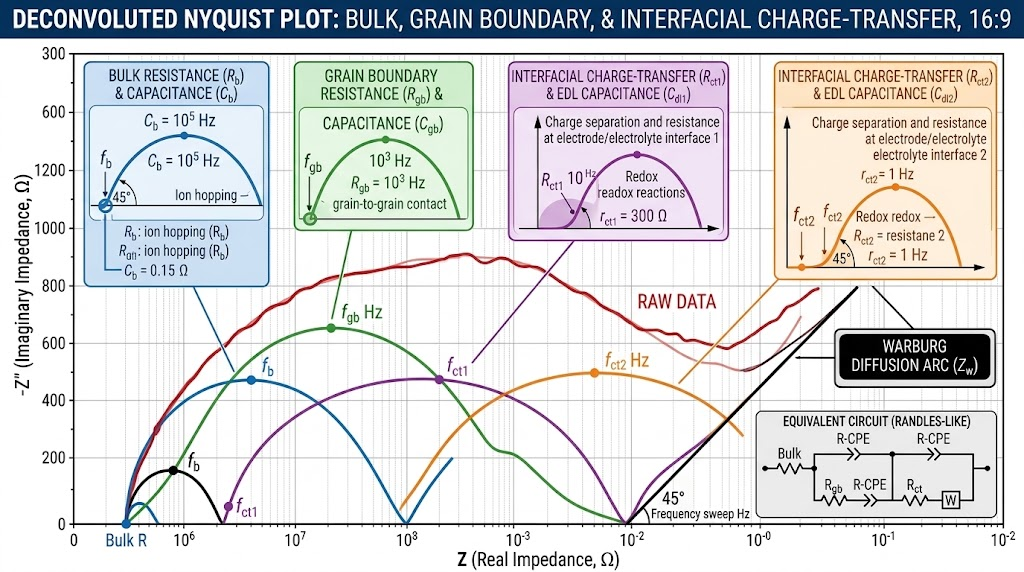
Deconvoluting the resulting Nyquist plot reveals the individual contributions to overall cell impedance:
- High-Frequency Intercept (100 kHz – 50 kHz): Bulk solid electrolyte resistance (
RbulkRbulk). This captures the intrinsic ionic resistance of the solid separator (e.g., sulfide argyrodite Li6PS5ClLi_6PS_5Cl
or LLZO oxide ceramic).
- High-to-Intermediate Frequency Arc (50 kHz – 1 kHz): Grain boundary resistance (
RgbRgb). Prominent in polycrystalline oxide systems, elevated RgbRgb
indicates poor particle sintering or boundary micro-fissuring.
- Intermediate-to-Low Frequency Arc (1 kHz – 0.1 Hz): Interfacial charge-transfer resistance (
RctRct). This corresponds to the activation energy barrier for lithium ions crossing the solid electrolyte into the cathode active material or lithium metal anode.
- Low-Frequency Tail (< 0.1 Hz): Warburg diffusion impedance (
ZwZw), representing solid-state lithium-ion diffusion within the composite bulk electrodes.
During prolonged cycling, void formation at the lithium-metal/solid-electrolyte interface during stripping causes a rapid increase in
RctRct. When incoming cell samples show an initial area-specific resistance exceeding acceptable limits:
ASRct=Rct×Aelectrode>15 Ω⋅cm2(at 25∘C)ASRct = Rct × Aelectrode > 15\ Ω·cm^2 (at 25^\circC)
the cell typically lacks functional interfacial engineering, such as atomic layer deposition (ALD) aluminum oxide (
Al2O3Al_2O_3) or alloy-forming interlayers (e.g., gold, silver, or zinc seed layers). These coatings ensure uniform chemomechanical contact.
External Stack Pressure & Fixturing Architecture: 0.5 MPa vs Laboratory Hydraulics
The primary barrier to commercializing all-solid-state cells is the external stack pressure required to prevent delamination during cycling. Laboratory evaluations routinely apply hydraulic presses exerting 5 MPa to 15 MPa to maintain contact across the lithium/separator boundary.
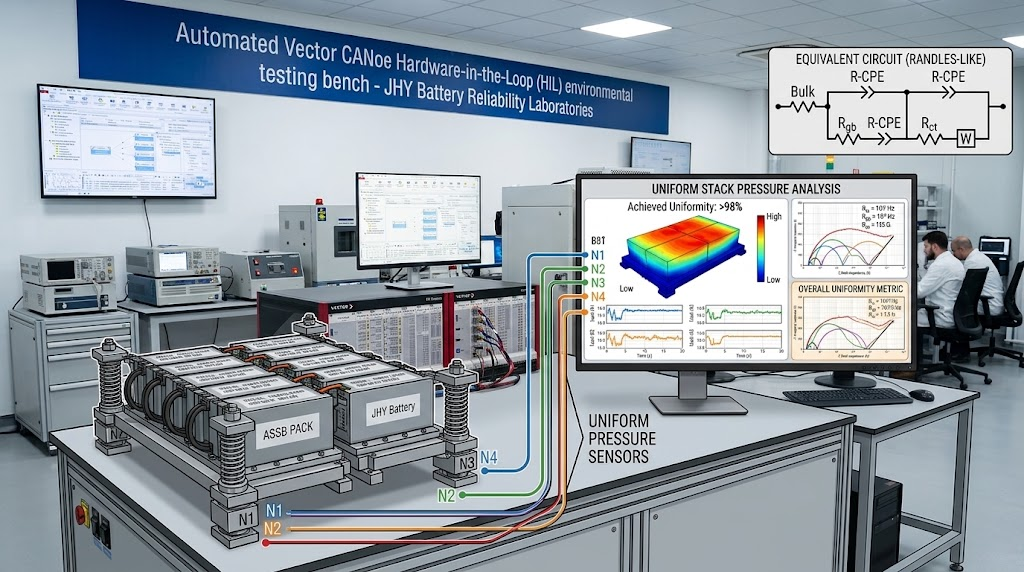
Translating these compressive requirements into a real-world battery module exposes serious mechanical constraints. Sizing the total clamping force for a pouch cell with broad-face dimensions of 150 mm × 100 mm (
Acell=150 cm2=0.015 m2Acell = 150\ cm^2 = 0.015\ m^2) requires significant mechanical support:
Fclamping=Ptarget×Acell=(5.0×10⁶ N/m2)×0.015 m2=75,000 N≈75 kNFclamping = Ptarget × Acell = (5.0 × 10^6\ N/m^2) × 0.015\ m^2 = 75,000\ N ≈ 75\ kN
A clamping force of 75 kN demands heavy steel endplates, high-tensile tie rods, and reinforced chassis bracing. This structural overhead can add up to 40% in dead parasitic mass, completely eliminating the gravimetric energy density gains of solid-state chemistries.
Solid-state pouch cells must be evaluated under viable commercial pressures:
Ptarget≤0.5 to 1.5 MPaPtarget ≤ 0.5\ to\ 1.5\ MPa. This yields manageable mechanical clamping requirements:
Fclamping=(1.0×10⁶ N/m2)×0.015 m2=15,000 N=15 kNFclamping = (1.0 × 10^6\ N/m^2) × 0.015\ m^2 = 15,000\ N = 15\ kN
A 15 kN load can be maintained throughout cycling using calibrated wave springs or high-resilience silicone foam sheets integrated directly between adjacent cells.
| Mechanical Architecture | Applied Stress ($P$) | Module Gravimetric Penalty | Tab Weld Fatigue Risk | Manufacturing Viability |
|---|---|---|---|---|
| Rigid Fixed-Gap Tie-Rods | Variable (0.1 to 12.0 MPa dynamic) | Medium (+12% to 18%) | High (Shear stress from dynamic cell expansion) | Unviable (Causes early pouch rupture) |
| Hydraulic / Pneumatic Assist | Constant 5.0 to 10.0 MPa | Extreme (>45% parasitic weight) | Low (Controlled constant load) | Laboratory scale only |
| Calibrated Spring Pack (JHY Architecture) | Constant 0.5 to 1.5 MPa (±0.15 MPa) | Low (+4% to 7% parasitic weight) | Minimal (Integrated strain relief loops) | Mass production ready (Automated assembly) |
Operating under unoptimized stack pressures also causes lithium metal creep. At pressures exceeding 5 MPa, metallic lithium deforms plastically into microscopic separator pinholes, accelerating dendrite short-circuits. Conversely, pressures below 0.3 MPa accelerate void aggregation during discharge cycles, degrading cell capacity within 200 cycles.
Thermal Boundary Decoupling: Charge Windows vs Low-Temperature Discharge
A common mistake in solid-state cell evaluation is assuming a uniform operating temperature range. Marketing materials often quote continuous operation from -40°C to +80°C. However, solid-state electrochemistry requires decoupling the charge window from the discharge window.
The Strict Charge Thermal Window (0°C to +45°C)
Charging an ASSB below 0°C without auxiliary heating is electrochemically unsafe. At sub-zero temperatures, the bulk ionic conductivity (
σLi+\sigmaLi^+) of sulfide and oxide solid electrolytes drops sharply:
σLi+(T)=σ0Texp(−EakBT)\sigmaLi^+(T) = \frac{\sigma_0}{T} \exp≤ft(-\frac{Ea}{kB T}\right)
where
EaEa represents the activation energy (typically 0.22 eV to 0.40 eV for argyrodites), and
kBkB is the Boltzmann constant.
When charging at sub-zero temperatures, slow ionic diffusion causes high interfacial overpotentials. Because the local potential drops below 0 V versus
Li/Li+Li/Li^+, metallic lithium deposits as self-propagating dendrites instead of smooth layers, which easily penetrate the solid electrolyte and short the cell. Charging protocols must strictly limit currents below 0°C, requiring active PTC or silicone heating elements to bring the core pack temperature above 10°C before applying currents > 0.05C.
The Low-Temperature Discharge Regime (-40°C to +80°C)
Discharging, by contrast, involves lithium stripping from the anode, which does not present dendrite shorting risks. In advanced ASSB chemistries, discharging down to -40°C is viable, though it requires derating for increased internal resistance (
RESRRESR):
- Discharge at +25°C: 100% nominal capacity at 0.5C rate.
- Discharge at -20°C:
≥75%≥ 75\%nominal capacity retention at 0.2C rate (with voltage cutoff lowered to 2.5V).
- Discharge at -40°C:
≥55%≥ 55\%nominal capacity retention at 0.1C to 0.2C rate.
Engineers designing systems for extreme conditions must integrate our extreme low-temperature batteries expertise, sizing internal heaters to avoid sustained low-temperature operation under load.
Operando Anode Breathing: Tracking Dynamic Thickness Expansion in Lithium Metal
Unlike conventional graphite or silicon-graphite anodes that intercalate lithium within a fixed host lattice, pure lithium metal anodes operate by continuous plating and stripping. A 20 Ah solid-state pouch cell using a 50 μm pure lithium metal foil experiences significant dimensional changes (“breathing”) during charge-discharge cycling.
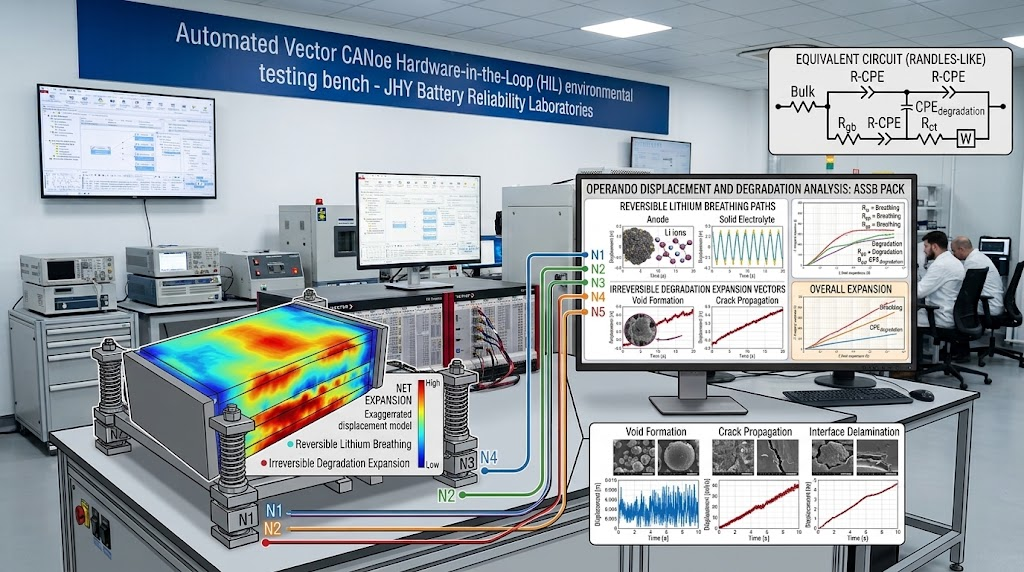
Plating 1 mAh/cm² of areal capacity corresponds to an electrochemically deposited lithium thickness of approximately 4.85 μm:
tLi=qarealρLi×F/MLi≈4.85 μm per mAh/cm2tLi = \frac{qareal}{\rhoLi × F / MLi} ≈ 4.85\ μm per mAh/cm^2
For a high-loading solid-state cell rated at 4.0 mAh/cm², the anode breathes by roughly 19.4 μm per layer during every charge-discharge cycle. Across a 20-layer double-sided pouch cell, this results in an overall dimensional swing:
Δtstack=20×19.4 μm≈388 μm≈0.39 mmΔ tstack = 20 × 19.4\ μm ≈ 388\ μm ≈ 0.39\ mm
If incoming cell validation only tests unconstrained displacement, the design will likely fail once assembled into a rigid pack enclosure. Rigid enclosures cause local mechanical stress to rise rapidly beyond 15 MPa at 100% state of charge (SOC), crushing the separator and inducing catastrophic short circuits.
Atmospheric Control & Safety Boundary Requirements: Dew Point and Toxic Gas Evolution
Incoming quality control facilities must maintain strict environmental boundaries when receiving, handling, and testing ASSB cells—particularly sulfide-based variants such as
Li10GeP2S12Li10GeP_2S12 (LGPS) or argyrodites. Moisture hydrolyzes these electrolytes on contact, producing hazardous hydrogen sulfide gas:
Li6PS5Cl+5H2O⟶5LiOH+LiCl+H3PO4+H2S↑Li_6PS_5Cl + 5H_2O \longrightarrow 5LiOH + LiCl + H_3PO_4 + H_2S\uparrow
Incoming test facilities must enforce clear atmospheric thresholds:
- Dry Room Quarantine Boundary: Dew point
≤−65∘C≤ -65^\circC(moisture concentration < 5.4 ppm).
- Inert Glovebox Atmosphere: Argon environment with O_2 < 1.0\ ppm そして H_2O < 0.1\ ppm.
- H2S Gas Detection: Continuous electrochemical sniffers configured to alarm at 5 ppm (OSHA PEL) and trigger automated emergency nitrogen purges at 10 ppm.
BMS Architecture & Protection Strategies for Solid-State Battery Packs
Solid-state battery modules require specialized battery management systems. Standard BMS architectures configured for conventional liquid-electrolyte cells lack the high-precision Analog Front End (AFE) sensing needed to monitor solid-state dynamics.
Solid-state BMS engineering must address three critical requirements:
- High-Precision Voltage Sampling: Automotive-grade AFEs (such as the TI BQ79616 or ADI LTC6813) must maintain sampling accuracy within ±1.5 mV across the -40°C to +80°C operating window. High accuracy is essential because lithium plating against high-nickel cathodes exhibits an extremely flat voltage plateau during overpotential transitions.
- Extended Kalman Filter (EKF) SOC Tracking: Because solid-state cells show minimal open-circuit voltage variation across the 20% to 80% SOC range, simple Coulomb counting drifts quickly. The BMS must use an adaptive Extended Kalman Filter that incorporates internal resistance changes (
RctRct) to maintain SOC tracking accuracy within 2.0%.
- Micro-Short Identification Algorithms: Before a dendrite causes a full thermal runaway, micro-shorting produces tiny negative voltage spikes (ΔV ≈ 10 mV to 30 mV over durations < 50 ms) accompanied by localized heating. BMS firmware must detect these rapid micro-voltage drops to isolate the affected module before separator failure occurs.
Explore our engineering capabilities in custom BMS design to see how we implement real-time impedance tracking, active balancing, and safety failsafes.
DFM Incoming Cell Screening Checklist: Engineering Tolerances and Binning Metrics
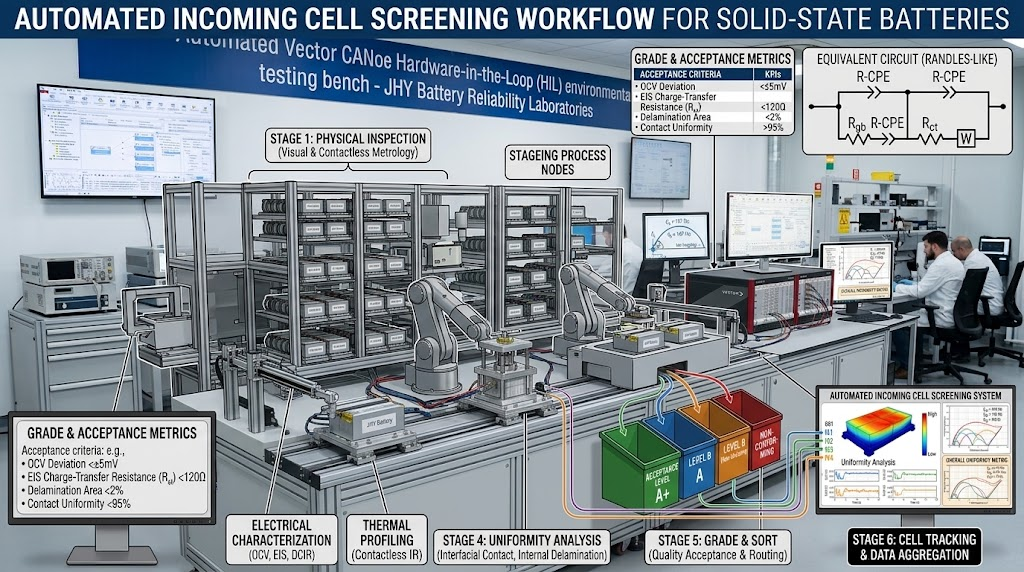
To eliminate early-life field failures, JHY Battery enforces a maximum 0.03% (300 PPM) defect rate across all incoming cell and pack operations. Incoming ASSB cell lots should undergo strict automated binning against non-negotiable tolerances.
| Screening Parameter | Measurement Protocol | Acceptance Metric | Rejection Root Cause |
|---|---|---|---|
| Open Circuit Voltage (OCV) | Calibrated DMM (6.5 digit) at 25.0°C ± 0.5°C | ΔV ≤ 3.0 mV across batch | Internal micro-leakage or cathode under-loading. |
| 1 kHz AC Impedance (ACIR) | Four-terminal Kelvin connection at 1.0 MPa | ΔR ≤ 0.3 mΩ (or ≤ 2.5% variation) | Poor solid electrolyte consolidation; interfacial voiding. |
| Static Self-Discharge (K-Value) | Quarantine over 14 to 28 days at 50% SOC |
K=ΔVΔt≤0.8 mV/dayK = \frac{Δ V{Δ t} ≤ 0.8\ mV/day |
Sub-critical dendrite channels crossing the separator. |
| Critical Current Density (CCD) | Stepwise polarization: +0.2 mA/cm² per 60 min |
CCD≥5.0 mA/cm2CCD ≥ 5.0\ mA/cm^2 (at 25°C, 1.0 MPa) |
Poor interphase chemistry causing rapid dendrite shorting. |
| Areal Capacity Loading | Coulomb counting at 0.1C discharge rate | ΔC ≤ 1.0% absolute matching | Inconsistent slurry coating or roll-to-roll calendering. |
To learn more about pack testing frameworks, see our overview of global battery certifications spanning UN38.3, UL 1642, UL 2054, and IEC 62133.
よくある質問
Why do lab-scale solid-state test results fail when integrated into commercial battery packs?
Academic research frequently relies on heavy hydraulic fixtures exerting 5 MPa to 50 MPa of uniaxial pressure and elevated temperatures (>60°C) to artificially lower interfacial resistance. In commercial pack engineering, fixtures exceeding 1.5 MPa drastically penalize system-level gravimetric energy density, add dead weight, and induce mechanical tab fatigue. JHY Battery mandates sample qualification under ≤0.5 to 1.5 MPa at ambient temperatures (25°C).
What is the engineering trade-off between sulfide, oxide, and polymer solid electrolytes during sample testing?
Sulfide electrolytes offer high ionic conductivity (up to 10^-2 S/cm) and favorable mechanical plasticity at 25°C, but require strict moisture isolation (dew point ≤ -65°C) to prevent toxic H2S release. Oxide ceramics offer superior electrochemical stability and safety but present rigid, high-impedance interfaces that crack under mechanical vibration. Polymers are cost-effective to process via roll-to-roll methods but exhibit unviable ionic conductivity below 60°C without plasticizers.
How do you verify whether an ASSB sample has Grade-A internal interfacial contact?
Grade-A contact is verified via high-frequency Electrochemical Impedance Spectroscopy (EIS, 100 kHz down to 10 mHz) at 25°C under ≤1.0 MPa. The Nyquist plot must show a deconvoluted interface charge-transfer resistance (R_ct) within manufacturer limits (typically <15 Ohm-cm²), absence of low-frequency Warburg scattering distortion, and a static K-value voltage drop ≤0.8 mV/day over a 14-day quarantine period.
How is Critical Current Density (CCD) verified without causing catastrophic dendrite failure?
CCD is established through a stepwise galvanostatic polarization protocol at 25°C with 0.1C to 0.2C step increases, holding each step for 1 hour. In-situ voltage profile monitoring detects micro-shorts (indicated by transient negative voltage dips and sudden overpotential drops) before catastrophic internal short-circuits occur, setting the safe maximum operational charging ceiling.
Accelerate Your Deployment with JHY Battery
Evaluating advanced all-solid-state cells requires partnering with an established manufacturer experienced in pack-level thermal, electrical, and mechanical fixturing. With over 30 years of industrial battery pack engineering and an ISO 13485-certified quality system, JHY Battery bridges the gap from sample testing to volume production.
Request a Custom Battery Consultation & Prototype Quote
Leverage our 1,200+ team members and 800+ R&D hardware engineers to evaluate your battery pack requirements, implement low-pressure fixturing architectures, and source certified prototypes.
- Step 1: Engineering Requirements Definition: Voltage, capacity, target stack pressure, and thermal operating boundaries.
- Step 2: DFM Analysis & Chemo-Mechanical Simulation: Interfacial EIS modeling, low-pressure mechanical fixturing, and smart BMS integration.
- Step 3: Rapid Prototype Delivery: Functional prototypes delivered in 5 to 7 business days, accompanied by complete MES screening telemetry and test dossiers.
Direct Engineering Contacts:
Email: Simple@chinabatterymanufacturer.com | joeshen@chinabatterymanufacturer.com
Direct Phone / WhatsApp: +86-18575997879